
If you prefer video content, here’s a tutorial from our Youtube channel.
Why speed is important
When you start working on the new site, the site speed is rarely on top of your mind. However, when the design and content are finalized, the question of site performance becomes acute.
Having a performant website is important for many reasons:
- It provides a better user experience. No one likes to wait a few seconds for your site to load.
- It improves the conversion rate. Whatever your Call to Action is, visitors are more likely to complete it if your site is fast and responsive. It also improves all the other website metrics (bounce rate, retention, etc.)
- Search engine (Google) rank your website higher. And thus bring more free visitors.
These are not just my words; they are backed by numbers.
You can use different approaches and metrics to measure your site performance. We’ll use the most common one: Google PageSpeed Insight (PSI) metrics, which they introduced as early as 2009 and started applying as a factor in the site ranking.
How to measure speed and performance
Google uses the tool Lighthouse to measure and report on the PSI site the following metrics of the website:
- First Contentful Paint (FCP).
- Speed Index (SI).
- Largest Contentful Paint (LCP).
- Time to Interactive (TTI).
- Total Blocking Time (TBT).
- Cumulative Layout Shift (CLS).
Each metric has a ‘weight’ from 10% (FCP) to 30% (TBT). You can play with the performance calculator here.
On the PSI site, you’ll also see the ‘Core Web Vitals Assessment’ (the average of the metrics computed over the previous 28-day collection period). Core Web Vitals include some Lighthouse metrics: (FCP, LCP, CLS); and some new: First Input Delay (FID), Time to First Byte (TTFB), and Interaction to Next Paint (INP).
Lighthouse metrics are more important for us right now. And we’ll be focusing on the mobile metrics, cos if you get mobile metrics right, desktop ones will be taken care of.
You can also measure site performance by running Lighthouse through the Chrome Console Dev tools, and select more options of what you want to measure on your site. And it’s better to run the analysis in the “Incognito” mode, to avoid any plugins interfering with the test.
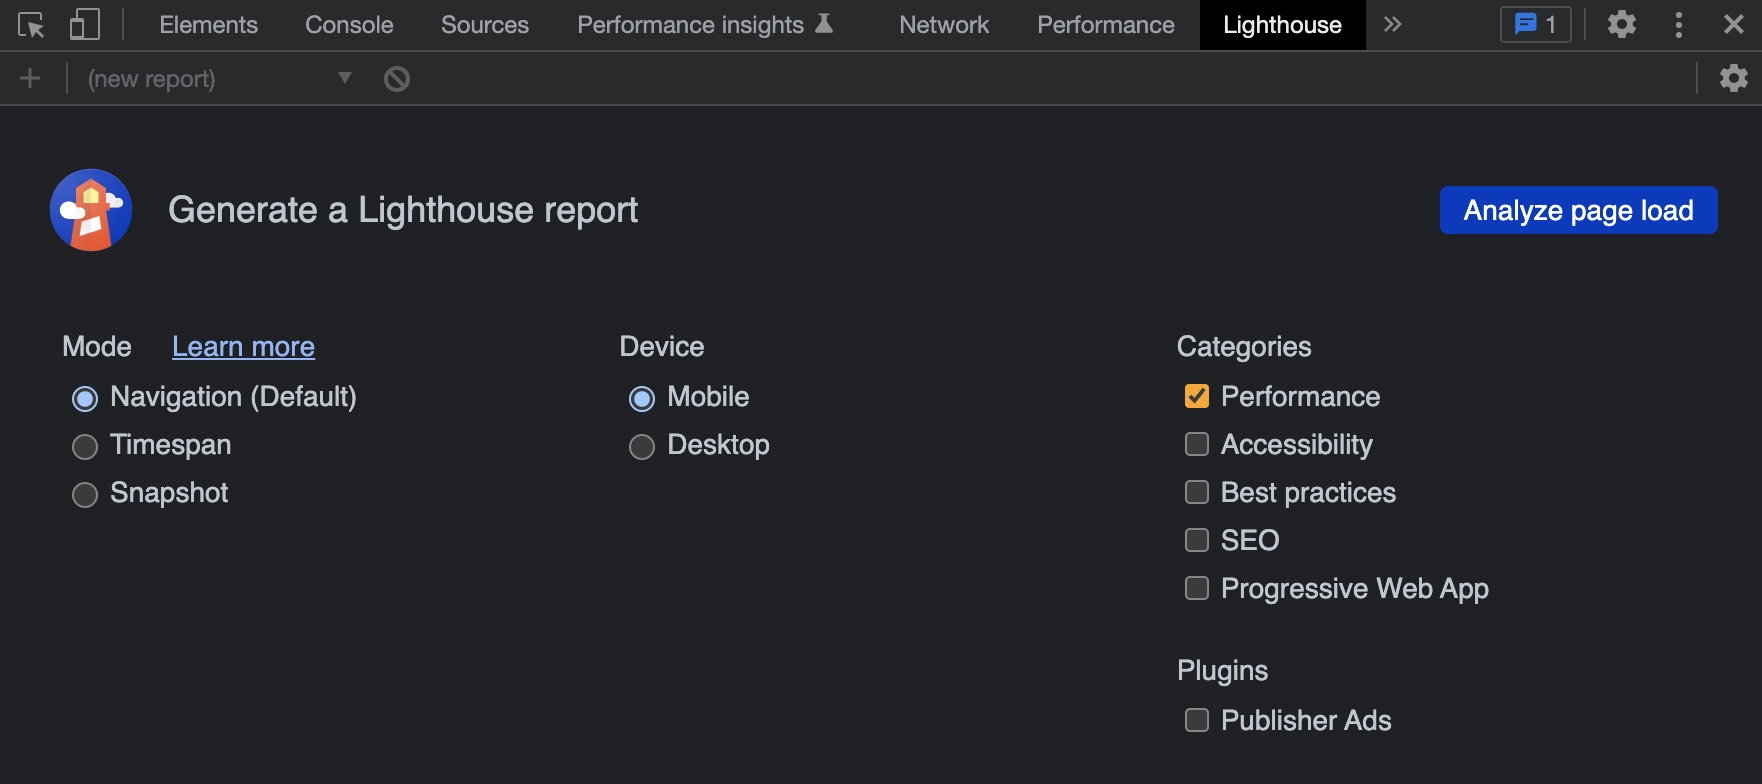
Let’s see how to achieve the best results with the Webflow site.
Webflow default speed optimization features
Not surprisingly, Webflow has many optimization features working out of the box. They deliver your site and assets through the Content Delivery Network (CDN). You can enable HTML/CSS/JS code minification (don’t forget to do it).

Webflow uses Responsive images to automatically resize your images for different screen sizes (through added “srcset”). It doesn’t mean you can stop paying attention to the image sizes, but it’s very useful and handy.

Webflow generates and stores static pages for your CMS collection items, lazy loads images by default, etc.
However, you’d need to do much more than that to create a snappy website. Let’s get to them.
1. Third-party scripts optimization
Third-party scripts are probably the number 1 cause of bad site performance. And it will be most likely the number one recommendation in your Lighthouse / PSI report.
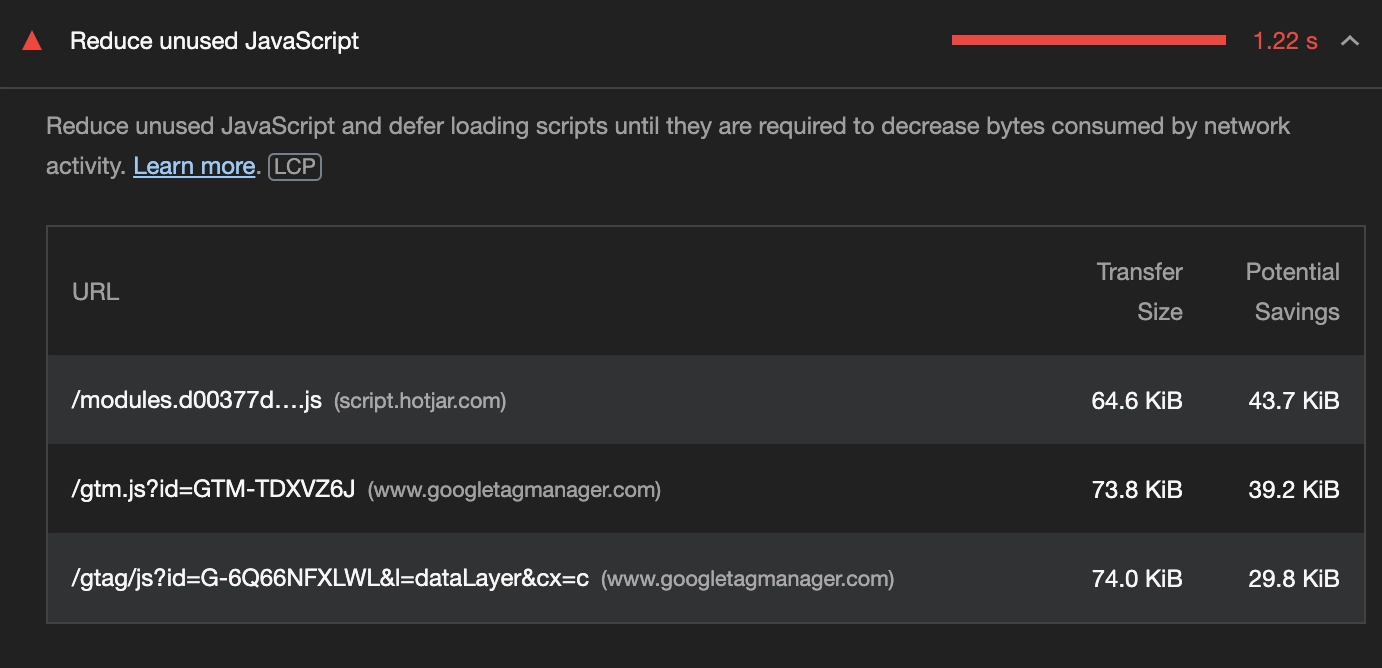
Unfortunately, no modern production website can get away without any scripts. You’d need at least 2-3 analytics and likely at least one ad library on your site. Here’s what you should do.
1.1 Leave only necessary scripts on each page
Carefully analyze all the scripts you use, and discuss with the stakeholders and your team what is absolutely necessary and what can be removed. Most likely, you have some remnants of the old analytics or styling effects lib that are no longer needed.
Ensure that the script is added only to the page where it’s used. A common mistake is to add a JS effect library that’s used on a single page to the global footer, which makes it load unnecessarily on all the other pages.
Leave in the global footer page only scripts that are used on every single page (like analytics, fonts, etc.)
And make a policy to test any new script through performance analysis before adding it.